Measuring The Google Analytics Metrics That Matter
Picture this - it's a Friday afternoon and you've just received the latest report from your agency or marketing team. There are numbers everywhere. Arrows - some green, some red. You flick through the pages, and then flick back through again to the front page. You pretend to understand what the numbers are saying, but deep down you know you don't understand.
You shift your attention to the 'summarised' notes that support the numbers to see if they help. It's a spillage of words all designed to mask a lack of work, focus, progress, or worse... All three. It's another useless report that the board will breeze over.

Jargon Venn
Does this sound familiar? If it does, then let me show you how to measure Google Analytics metrics will grab their attention. In addition, there will be some metrics that you will need to measure outside of analytics also, but the combination is a powerful one.
Did you know that CMOs (and marketing personnel in general) have the shortest job spans of any C-Suite role?
"But why?", I hear you say.
One answer could be that many marketers just aren't measuring the right things. They aren't measuring what CEOs and CFOs are measuring. These people are measuring things like revenue growth and profitability. They're not so fussed about 'awareness' or social followings. Marketers continue to get things confused - blinded by awareness.
Profitable businesses always have awareness, but businesses with awareness aren't always profitable.
Ok, time for a pick-me-up!
Measuring the right things isn't difficult and you can start right now. This post is not about diving deep into your data. It's about measuring top level key indicators that can show you the bigger picture.
There are 3-4 key metrics that tell you almost everything that you need to know about marketing performance whilst providing a level of financial intelligence that can be understood by your board. These metrics will help you to get your board invested and interested in what you're doing, because you'll be talking their language. Sure you can dive deeper when required, but why complicate things unnecessarily?
You will be measuring three metrics if you're an ecommerce businesses, and an additional metric if you're dealing with enquiries or leads that require further work to complete the sale.
Traffic
Traffic is the timeless metric that has been measured since the web became mainstream. I remember checking webSTAT 'hits' way before the days of Analytics and other tools. I was completely fooled by the thousands of 'people' landing on my website, only later realising that crawlers, bots, and refreshes/sessions were also counted in single units. But hey, it inspired me enough to have me write this post almost 20 years on.
These days of course, we're lucky to have much more sophisticated systems with the most common of them being Google Analytics.
There are two types of traffic indicators; Users and Sessions.
'Users' counts the number of unique visitors to your website, whereas 'Sessions' measures the number of visits to your website. If two different visitors land on your website, you have two (unique) users. If one of those visitors comes back* to your website an hour later, you still have two users, but you will record three sessions. So one user can log multiple sessions on your website.
Both Users and Sessions are equally important when it comes to your data, depending on what you're trying to measure.
Here's a tip - in Google Analytics, both your Goal Conversion Rate and Ecommerce Conversion Rate are measured against Sessions.
Therefore it's easier to measure Sessions, but it's worth noting that Users might give you a different perspective of events. Conversion Rate Optimisation experts, Conversionista!, asks a great question to help determine which is more relevant to your goals:
Is this something we want visitors to do every time they visit, or something we want as many visitors as possible to do?”
If the answer is the former, such as using a web app or logging into an account, then Sessions would make sense. If the answer is leaning more towards the latter, such as generating leads or sign-ups, then Users would be the better choice.
The absolutely crucial thing is that you measure one of them.* Some actions such as clearing cookie data will reset the user's sessions to zero, in which case the return visit would count as another unique user.
Goal Conversion Rate % / Ecommerce Conversion Rate %
Once you have traffic arriving at your website, you're going to want them to take action. This is where goals come in, and you can learn about setting those up in Analytics here. A goal is triggered once a desired action has been completed and, in Google Analytics, this is measured against Sessions.
There are two types of conversions that we're interested in (at a top level) depending on what business we're in:
If you transact and take payment online through an ecommerce system, then you're going to be most interested in your Ecommerce Conversion Rate %.
If you generate leads through your website or attract sign-ups, brochure downloads, or similar, you will need to set these up and they will be measured as goal conversions.
Whichever metric you select, it will tell you the % at which you convert your website visitors into customers or opportunities.
Conversion Rate % (Lead to Sale)
If you're a business that generates leads through your website, then you probably have some extra steps to go through before you close the deal.
This means that not everybody who converts through your website will end up converting into a customer. As a result, you need to measure the % of people that do convert, so that you can build an average to work with.
Once you have this metric, you will be able to better understand the number of visitors who actually turn into customers.
Average Order Value (AOV)
You now know how many visitors are coming to your website, and how many of those visitors are converting into customers. This is powerful information to report back to any management or board.
We can make it even more powerful by understanding what the average order is worth to our business. Oftentimes, I hear the excuse, "but it varies, one sale could be £500, and another could be £50,000". That's great! You have £50,500 in revenue, divided by two sales equals an AOV of £25,250.
It's really that simple. Take the total revenue over any given period in your business, and divide it by the number of sales/transactions you've made in the same period. This will give you your average order value. This should be reviewed and recalculated periodically (every quarter, biannually, or annually) to ensure that you're working with an accurate figure.
The power is now yours
You are now armed with between three or four key metrics that speak the language of business that anybody in your business will be able to understand.
These figures tell you what's coming in the top of the funnel, and what's converting out the bottom. You also have, crucially, your AOV meaning that you can begin to calculate the revenue generated both currently, and in future.
The calculation is as follows:
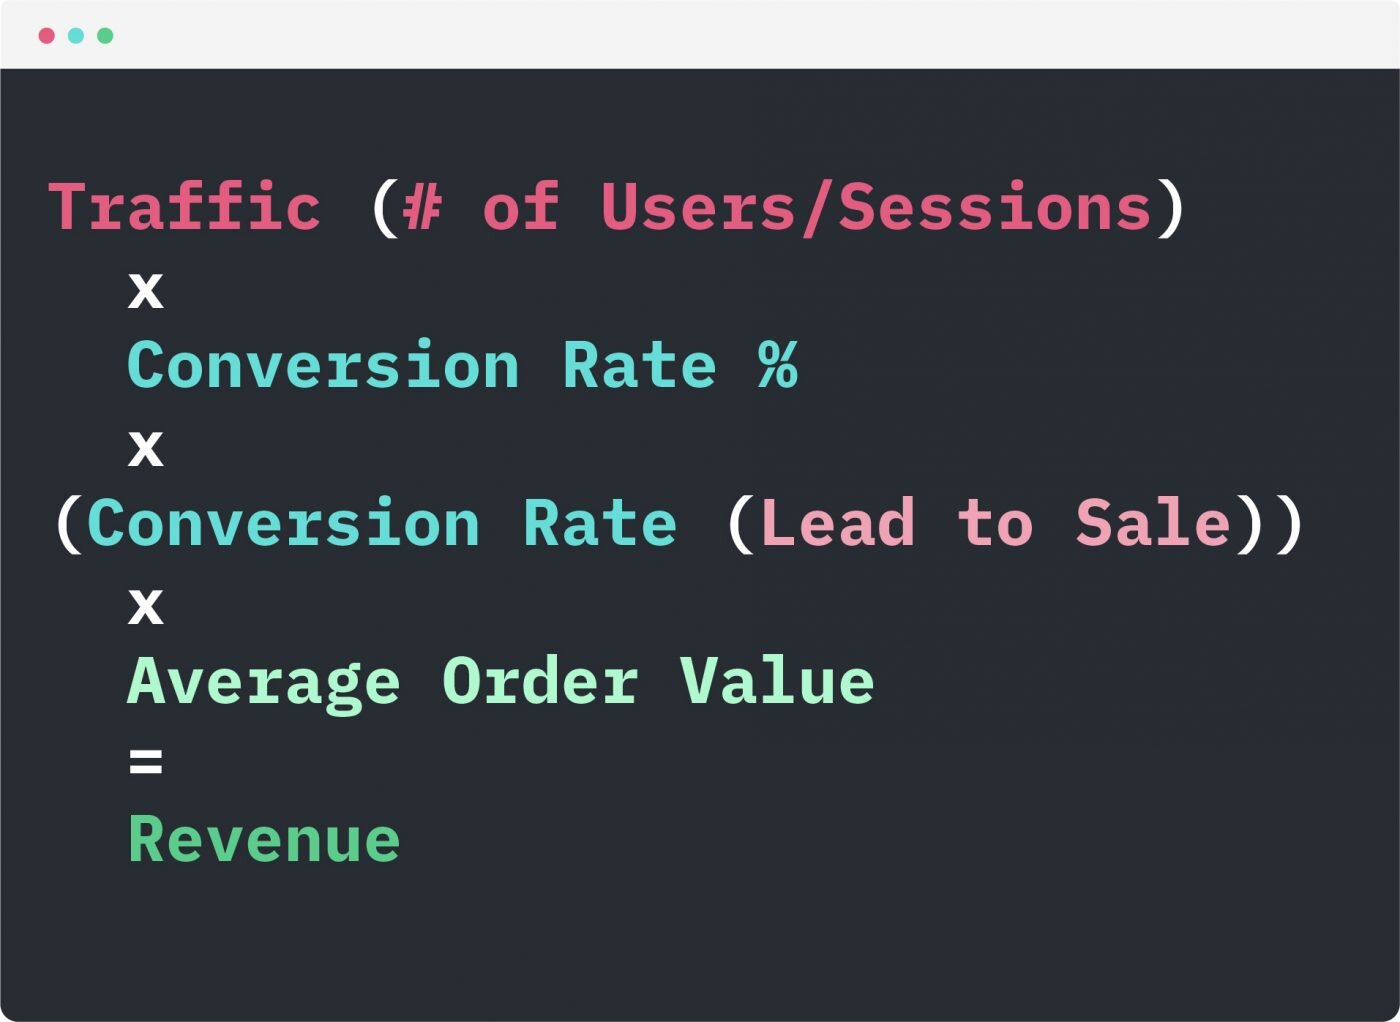
Copy and paste version:
Traffic (# of Users/Sessions)
x
Conversion Rate %
x
(Conversion Rate (Lead to Sale))
x
Average Order Value
= Revenue
With this information, you can begin to tweak your numbers to set new revenue goals very easily. Now, clearly, these numbers are going to be accurate only to a certain point, but the point is that we're working off proven averages over extended periods of time. You must trust the Law of Large Numbers.
Wikipedia defines The Law of Large Numbers as:
In probability theory, the law of large numbers (LLN) is a theorem that describes the result of performing the same experiment a large number of times. According to the law, the average of the results obtained from a large number of trials should be close to the expected value, and will tend to become closer as more trials are performed.
The LLN is important because it guarantees stable long-term results for the averages of some random events. For example, while a casino may lose money in a single spin of the roulette wheel, its earnings will tend towards a predictable percentage over a large number of spins. Any winning streak by a player will eventually be overcome by the parameters of the game.
The detail that sits behind this is important, but it's not data that needs to be constantly reported on at a management or board level. How you achieve the goal of increasing your traffic by 25% and conversion rate by 50% is down to you. Chunking this down into smaller key results and activities will now give you focus towards results that will grow your business.
We've built the best tool out there to help you to plan your objectives in an interactive and engaging way. We call it the Growth Calculator, and it's available for you to use for free. Once you've worked out your targets, we have the exact framework to help you to achieve those goals, and we'd love to talk to you about it. Simply submit your targets using the calculator and we'll do the rest.
And if you see this as a strategy you'd like to discuss, but don't necessarily have the time or skill to do it yourself, you can book in a free Strategy Call to discuss your project.